DataScience_Examples
All about DataSince, DataEngineering and ComputerScience
View the Project on GitHub datainsightat/DataScience_Examples
PowerBI
Udacity: Data Analysis and Visualization with Microsoft Power BI Dax Studio PowerBI
Power BI = Power Query + Data Model + Power BI Report
Power Query
- Multiple data sources
- Change structure without changing the source
- Auto-refresh
- Get data in PowerBI or Excel
Data Model
- vlookup, xlookup, index-match
- range of calculations you want to apply
- Keys to support relationships
Power BI Report
- Enable users to explore data
- Avoid versioning of report
- Access to dataset, data flow or data model
M vs DAX
| M | Both | DAX |
|---|---|---|
| Data Connections | Calculated Columns | Calculated Measures |
| Data Fromatting | Calculated Tables | Analysis |
| Data Cleaning | Table Splitting (M) | Analysis |
| Data Organizing | Tabel Joining (M) | Visual Filters |
| M | DAX | |
|---|---|---|
| Pro | Evaluation at refresh | Flexibility with measures and filters |
| Con | No measures | Can slow down data model |
Data Model
Components
- Dimensions: who, what, where, when, how, why
- Facts: what, how much
- Additive Facts
- Semi-Additive Facts
- Non-Additive Facts: Percentages …
- Keys: Connect dimensions to facts
Key Questions
- Key data to calculate?
- How is the data grouped of filtered?
- Where can we access the data?
- Do we need access rights?
- Any sensitive data?
- Can we rely on the data?
Date Tables
Calendar(<startdate>,<enddate>)
CalendarAuto()
Dynamic Date Table
New Source > Blank Query
= Date.StartOfYear(List.Min(#"Sales Transactions"[Date]))

= Date.EndOfYear(List.Max(#"Sales Transactions"[Date]))
rename Queries “Start” and “End”.
New Source > Blank Query
= {Number.From(#"Start")..Number.From(#"End")}
convert to table, convert column to date format.
Relationships
Direction from dimension table to fact table.
| Cardinalitly | Description |
|---|---|
| One-to-many | One value in dimension table relates to many values in fact table |
| One-to-one | |
| Many-to-many |
| Filter direction | Description |
|---|---|
| Single | Filters can be applied in one direction |
| Both | Filters can be applied in both directions |
Bi-Directional Filters
- One-to-one Relationships
- Bridging Tables
- Unique Slicer Requirements
- Dimenstion to Dimension Analysis
One-to-One
Check, if a merged table is possible for the requirement.
Many-to-Many
An item is related to multiple categories. Leverages bi-directional filters. Causes unpredictable results.
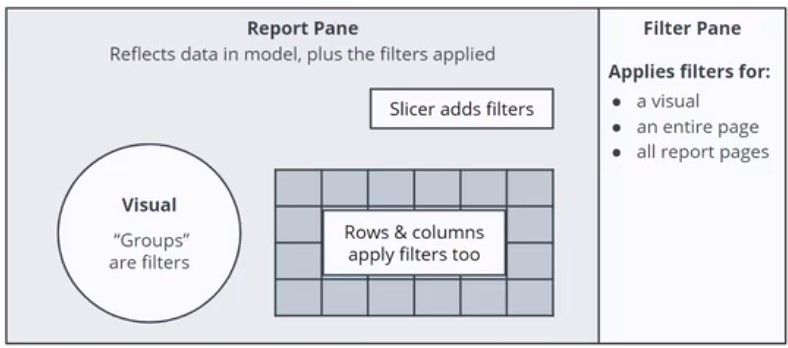
Filters and Visuals
Report pane reflects data in model, plus the filters applied. Filter pane applies filters for a visual, an entire page or all report pages.
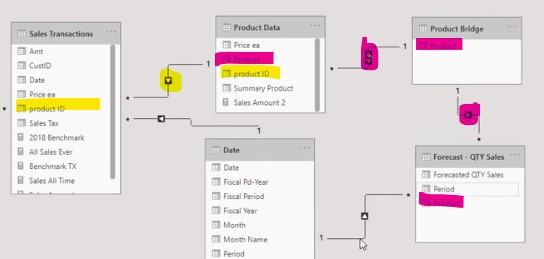
Two Fact Tables
If on of the fact tables has as different level of granularity, a many-to-many relation might occur. To avoid suach a relation, use a Bridge table. Fact Table High Granularity < many-to-one < Dimension 1 with additional column for lower granularity > many-to-one > Bridge > one-to-many > Fact Table Low Granularity
Multiple Date Tables
Use the dax function USERELATIONSHIP to express to which of the many date columns in your fact table the date table should relate to. Examples for different date columns might be order date, shipping date …
Another option is to create new date tables for each date column.
Disconnected Tables
Table is not related to fact table, like a “What-if” Parameter.
New Forecast = 'What-if'[Forecast Adjust Value] * sum('Forecast'[forecast QTY Sales])
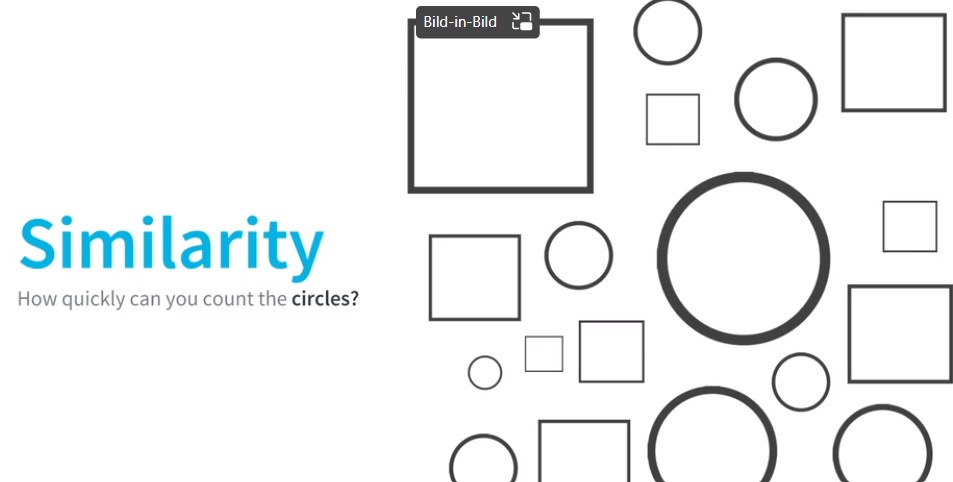
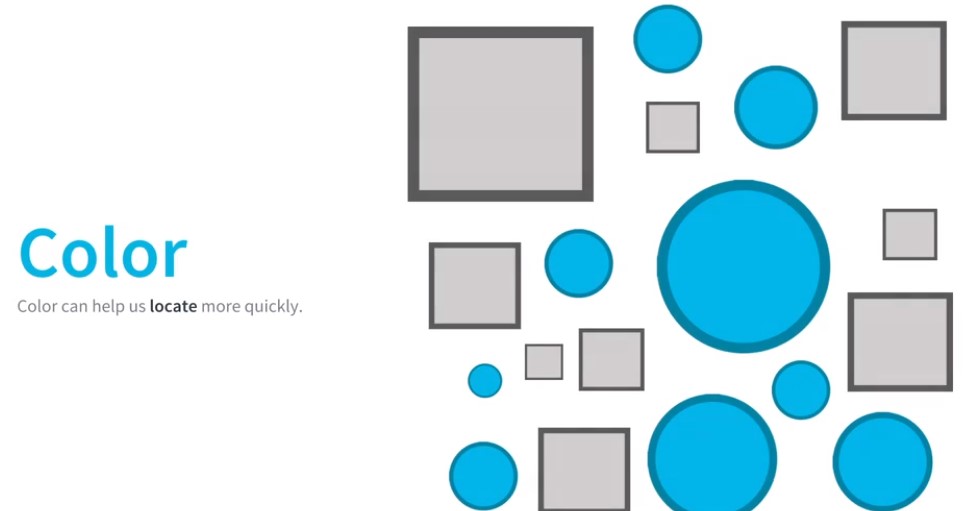
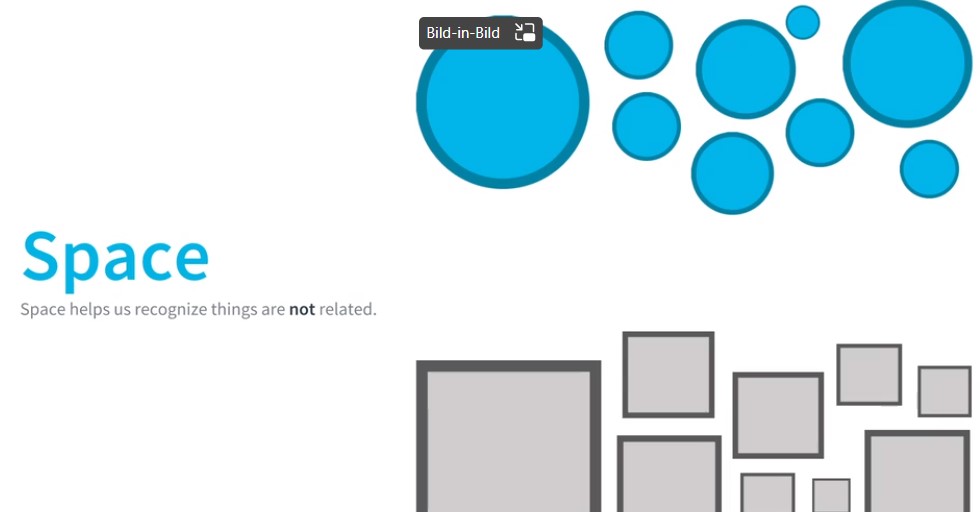
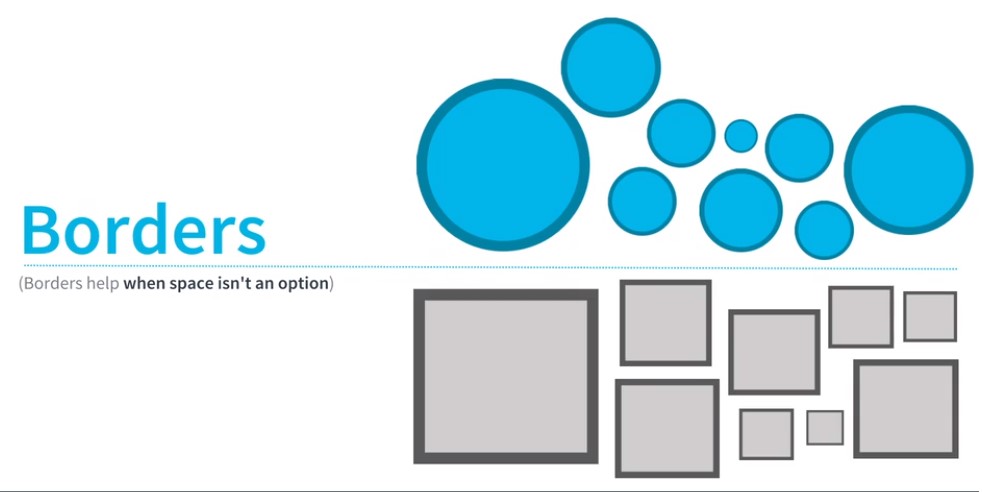
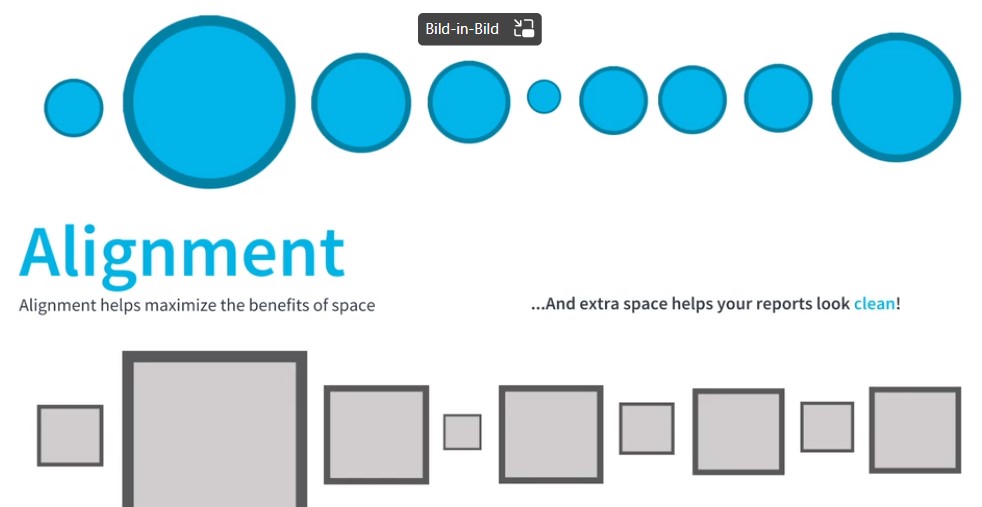
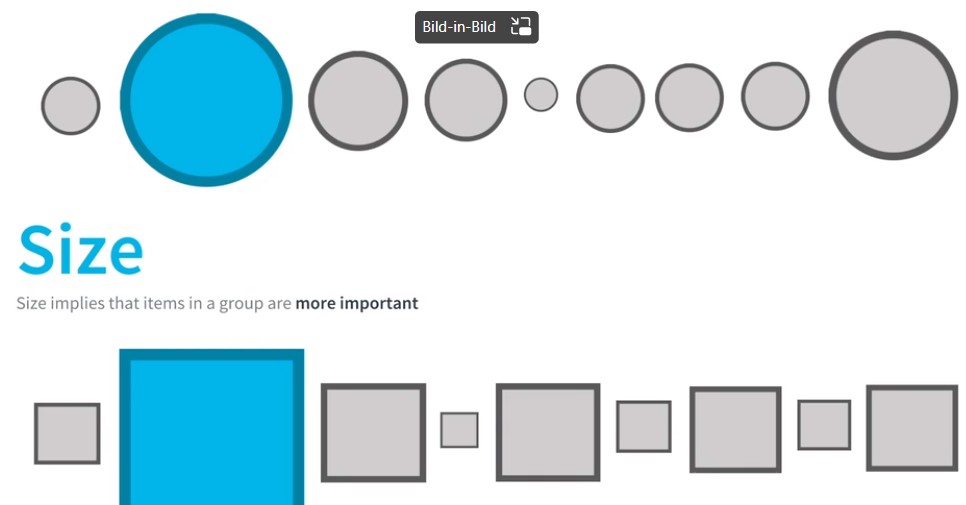
Visualization
Design principles.
| A | B | C | D |
|---|---|---|---|
 |
 |
 |
 |
 |
 |
 |
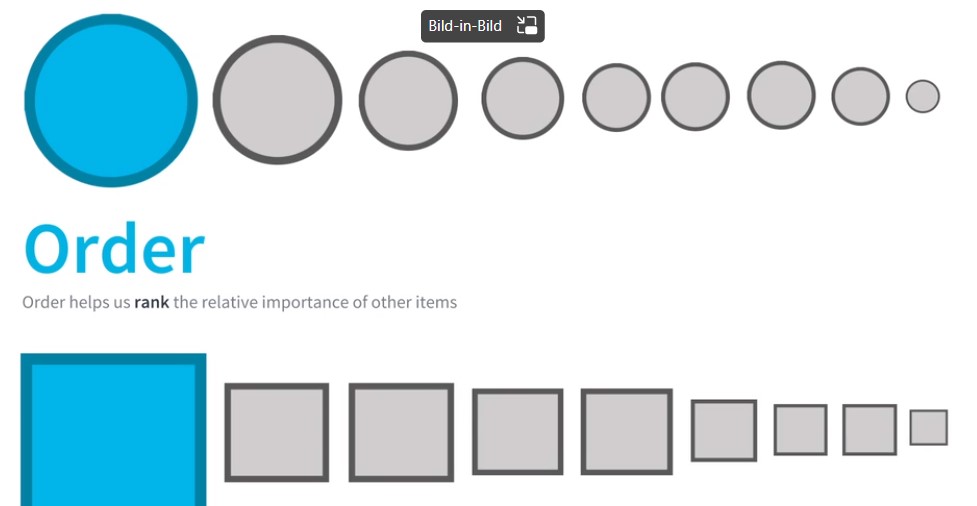 |
Chart Types
Bar Charts
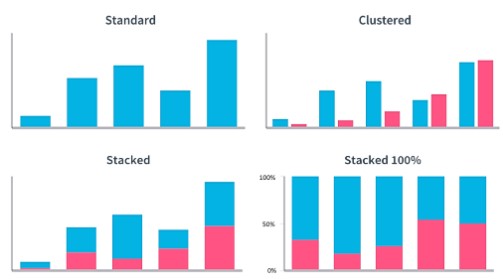
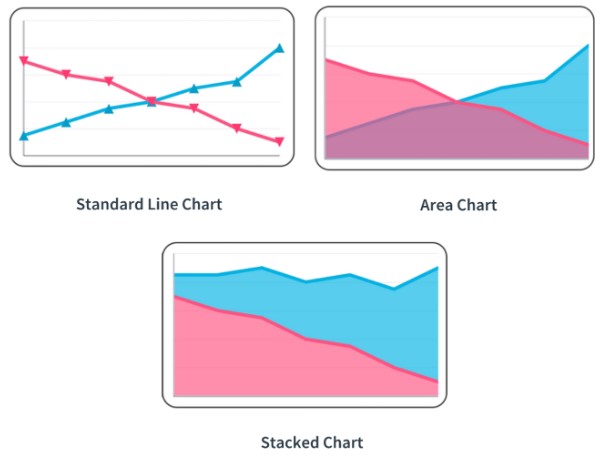
Line Charts
Advanced Data Visualization
###
Write Data from BPI to SQL
https://www.youtube.com/watch?v=WgIhsF7kEjI
https://www.youtube.com/watch?v=uPHwjPRnRwE
Data Analytics
Analytics Process
| Stage | Description | Example |
|---|---|---|
| Define | Problem Statement | We need to prepare for the challenges of an aging population |
| Construct | Research Topic | Which countries age the fastest? |
| Retrieve | Access Data Sources | Census data, population statistics, economic data |
| Cleaning | Clean and Organize the Data | |
| Conclusion | Take Measurements, make Conclusion |